Editor's review
This is a SQL code profiler.
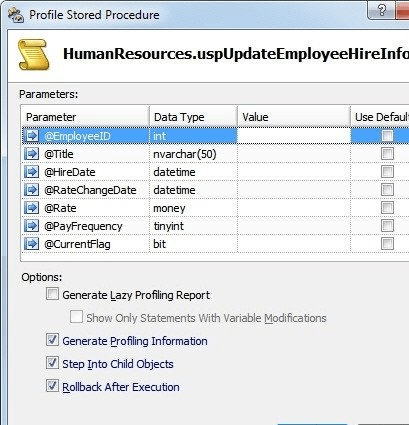
ApexSQL Profile profiles SQL code directly in SSMS. The profiler would provide visual indication of each SQL statement execution time. You would be able to identify any bottlenecks. It makes it easy to view parameters and variable changes over time. Which code line causes the changes in the variables and parameters could be identified. Thus you could trace exactly what is happening. This profiling will let you identify inefficient SQL code directly. Performance issues at each code line are visible easily. History of changes in the parameters and variable could be tracked easily. This has a simple and easy to use interface. It is intuitive enough that most users should get familiar with it quite easily. Getting productive with it should not take much time for the IT types. Profiling options help you customize the complete information. The options you could choose include “generate profiling information”, “Step into child objects” and “rollback after execution”.
When monitoring performance, you would be able to specify the default values or some value that would trigger the critical condition. These borderline code statements will determine exactly what is going wrong! Quick navigation of the results dashboard is possible for you make sense of the data presented. Comprehensive reporting facilities are available. End-user reports detailing the performance analysis reports are provided. This tool supports all SQL Server versions and creates the SQL code profile in SSMS directly. Sluggish performance at code statement level is identified visually. This is a very good product. If you are looking for a similar solution, you should try it in your exact workflow.
User comments